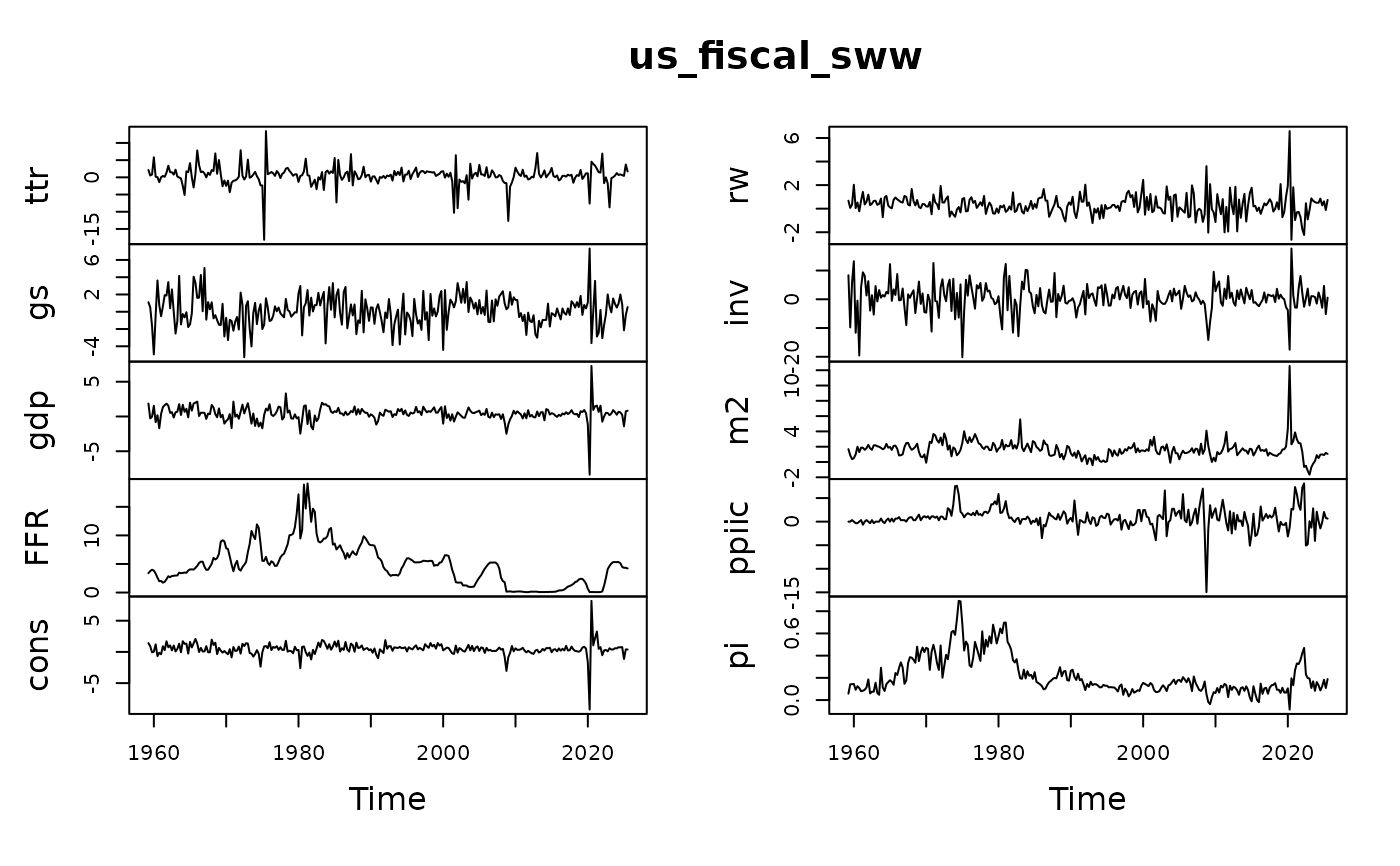
A 10-variable US fiscal system for the period 1948 Q1 – 2025 Q3
Source:R/us_fiscal_sww.R
us_fiscal_sww.RdA system used to identify the US fiscal policy shocks used by Shang, Wang, Woźniak (2026). Last data update was implemented on 2026-08-18.
Usage
data(us_fiscal_sww)Format
A matrix and a ts object with time series of over three hundred observations on 10 variables:
- ttr
quarterly US total tax revenue expressed in log, real, per person terms
- gs
quarterly US total government spending expressed in log, real, per person terms
- gdp
quarterly US gross domestic product expressed in log, real, per person terms
- FFR
quarterly Federal Funds Effective Rate
- cons
quarterly private consumption expressed in log, real, per person terms
- rw
quarterly real wages expressed in log, real, per person terms
- inv
quarterly private non-residential investment expressed in log, real, per person terms
- m2
quarterly Monetary Base M2SL expressed in log, real, per person terms
- ppiic
quarterly Producer Price Index by Commodity: Industrial Commodities expressed in log, real, per person terms
- pi
quarterly inflation rate expressed in log, real, per person terms
The system was defined by Mountford, Uhlig (2009) and used by Shang, Wang, Woźniak (2026).
Source
U.S. Bureau of Economic Analysis, National Income and Product Accounts, https://www.bea.gov/
FRED Economic Database, Federal Reserve Bank of St. Louis, https://fred.stlouisfed.org/
References
Lütkepohl, H., Shang, F., Uzeda, L., and Woźniak, T. (2025) Partial identification of structural vector autoregressions with non-centred stochastic volatility. Journal of Econometrics 256, 106107, doi:10.1016/j.jeconom.2025.106107 .
Mountford, A. and H. Uhlig (2009) What are the effects of fiscal policy shocks? Journal of Applied Econometrics 24, 960–992., doi:10.1002/jae.1079 .